Feeds:
Posts
Comments

Posts Tagged ‘mortality’

by Ralph Smith, Deputy Head of Public Health Information, Public Health, Sandwell Metropolitan Borough Council

The future of some vital public health-related information hangs in the balance as a result of the ONS Consultation on Statistical Products 2013.  The bland title of the consultation belies the rich and varied statistical products it covers.  They are divided into four areas, with the last two representing the bulk of the products in question:

•    Output from national surveys, such as the general lifestyle survey
•    Regional and local outputs
•    Health statistics and analysis, life events
•    Health inequalities analysis

Respondents are asked to state what the impact would be of discontinuing the product and encouraged to expand on the consequences if an impact is anticipated.

There are some critical products on the list and I encourage public health professionals to take part in protecting them.  Increasingly, policy documents are emphasising the importance of robust data sources and analysis, so it is an unfortunate time for ONS to be proposing cuts.

We are all going through a period where the provision of local public health analysis is under pressure due to a shortage of skilled staff, increased demand in a Local Authority environment and problematic relationships with the NHS over access to data.  At the same time we are reliant on national organisations, such as ONS and Public Health England, to provide nationwide data produced through economies of scale.

The consultation document often refers to alternative sources of data to the one they are suggesting they may cut.  But what happens if that alternative source dries up too?

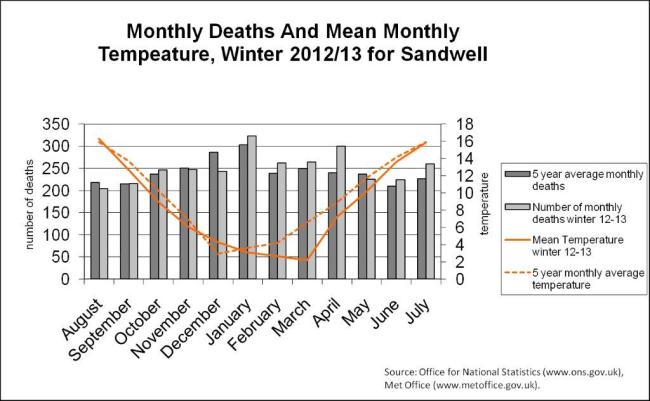
One proposed product to discontinue is the monthly reporting of death registrations.  The monitoring of excess winter mortality relies on such data sources, both nationally and locally.  Indeed Local Authority Public Health has its own supply of mortality data, via the primary care mortality database.  What the national monthly data provides are vital comparators to help make informed analytical decisions in areas such as health and housing.

Image

Figure 1: monthly death and mean monthly temperature, Winter 2012/13 for Sandwell

Winters may be getting warmer on average, but cold snaps are happening later in the season.  Thus, austere conditions that influence a household’s ability to heat their home means that such health and housing topics are still very much on the agenda.
In the health inequalities section of the consultation, many of the products are vital to public health.  They act as either a national benchmark to monitor progress, or provide small area analysis for local authority public health to reduce inequalities within their boundaries.  Life expectancy and healthy life expectancy analyses were first commissioned from the Marmot secretariat.  This small area intelligence was used to draw attention to the spread of health inequalities within an area, helping to target scarce resources.  A refreshed update of these data is under threat.

ImageFigure 2: Life expectancy and disability-free life expectancy at birth, by neighbourhood income level, England and Sandwell 1999- 2003

There are several products that take a closer look at health outcomes by protected equality groups such as occupation, deprivation and gender. Often there are no alternatives to such analyses.

Discontinuing the products outlined in this consultation does not only affect the professional public health world.  The idea of using freely available datasets and presenting them simply and clearly is increasingly popular with the media, charities and the voluntary sector.  The Guardian Datablog frequently uses ONS data to drive home a story.

Coupled with novel ways of presenting information, this brand of data journalism creates debate on current social issues.  And it’s not only the broadsheets that use this method.  The free paper the Metro frequently uses public domain national data to producer infographics such as the one below.

ONS are not looking to discontinue all the products listed in the consultation.  However they are looking for users to help them prioritise statistical products, some of which have to be cut to help contribute to annual savings of around £9 million.  I encourage you to take part in the consultation and emphasise how important  the majority of the products are in influencing policy and informing interventions.
Read Full Post »

by David Stuckler and Martin McKee

An early warning sign of a society in distress is when public health statistics begin to deteriorate. In 1981, the US economist Nick Eberstadt was one of the first to warn that the USSR was in deep trouble, based on evidence of rising infant mortality.

Lately several such warnings have been lighting up in the UK. One is a significant increase in suicide rates, numbering 1,000 additional suicides over and above historical trends between 2008 and 2011. 

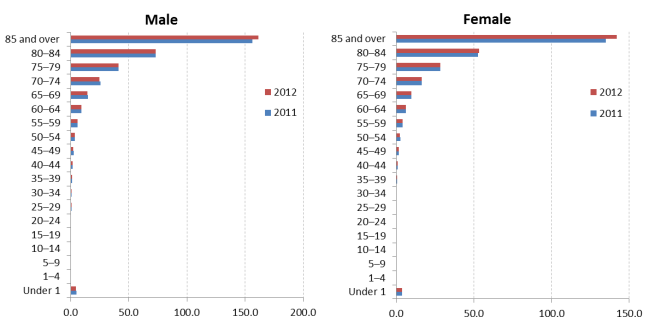
The charity Mind reported a 50% increase in distress calls in 2012, alongside a significant rise in new cases of depression.  Another is a worrisome increase in age-standardised death rates, concentrated in those older than 85 years of age, reversing a past decline (see figure 1). Had deaths rates in persons over-85 remained at 2011, there would have been about 2,200 fewer deaths in men and 6,150 fewer deaths in women.

Image

Figure 1. Trends in age-standardised death rates in persons ages 85+ per 1,000 population, 2011 and 2012
 
Why did mortality rates increase in persons over 85 in 2012? Is this a result of an unusually bad flu season? An increase in hospital-borne infections? A result of suicides and other external causes? Or something else?

One possibility is that this rise is a statistical artefact. People aged over 85 are at the highest risk of dying, and so even a large rise in the number of deaths may have occurred by chance alone. However, the UK Office for National Statistics has concluded that the increase is a statistically significant departure from past trends.

Another possibility is that British emigrants returned from crisis-stricken countries, such as Greece, Spain, and Portugal, so artificially swelling the numerator. Yet it seems implausible that sufficiently large numbers of people could have returned and died in such a short period so as to drive the mortality increase.

Taking it as given that the rise is significant and has its roots in domestic causes, to understand whether these deaths could have been avoided, it is necessary to first evaluate the immediate causes of the increase in deaths.

Using the data from the Office for National Statistics annual mortality reports for 2011 and 2012, we decomposed the changes in mortality numbers by specific causes of death for men and women. Figure 2 shows the contribution of 17 International Classification of Disease (ICD) categories to the overall all-cause mortality increase. As shown in the figure, the greatest cause of rising deaths was from “mental and behavioural disorders” (ICD F01-F99) attributable for 34% of the rise in women and 21% in men.On closer inspection, we found this specifically pertained to two sub-categories, “vascular and unspecified dementia” (ICD codes F01 and F03).

Image

Figure 2. Decomposition of the causes of the increase in mortality numbers, 2011-2012

The next largest cause of death was from circulatory diseases, accounting for an additional 22% of the rise in women and 20% in men. Within this cluster of causes of death, the rise was mostly classified as ‘other heart diseases’ and ischaemic heart disease.

Using data on cause of death, we were able to rule out several possibilities. It has been speculated that influenza and pneumonia contributed to the observed rise. However, on closer inspection, these combined categories contributed to only 5.8% and 3.5% of the increase in mortality numbers in men and women, respectively. Deaths from infectious diseases declined, further ruling out the possibility of hospital-borne infections. Additionally we found that external causes of death, including traffic accidents and suicides, were relatively small contributors to the observed mortality changes.

What do these data imply for healthcare professionals, and policymakers? While it is too early to draw strong conclusions, it is clear that there is a need for close monitoring of the health of older people. There appears to be no one specific cause of death or disease outbreak that is responsible for the rise in mortality.

However, as a caveat, it is difficult to ascertain precisely the immediate cause of death in older people, when they may have multiple and interacting co-morbidities. Further analysis should evaluate these mortality patterns by geographical area, particularly with a view to understanding whether the mortality increase was disproportionate in more deprived communities and those hit most by budget cuts.

As with all public health data, these trends cannot be fully understood independently of current social and economic circumstances. One pressing concern is that older people are bearing the brunt of recession and budget cuts. Compared to 2009, 14% more people over 65 were declared bankrupt in 2012, whereas in every other age-group the rate of bankruptcies declined in this same period. 

This hardship exacerbates an already bad situation. British pensioners have the fourth greatest risk of poverty in Europe, behind Bulgaria, Cyprus, and Spain.  The Coalition government’s deep cuts to housing support and winter allowances may further place older persons in harm’s way. We know that older people’s confidence and engagement with life are important determinants whether they will age successfully. 

However, both salutogenic factors are under threat, the first because of the sustained attacks on them by some politicians and sections of the media who seek to exploit generational divisions as a pretext for further cuts in the welfare state,  and the second by cuts in local government budgets, such as libraries, day, and sports centres, that reduce older people’s opportunities to meet with others.

There are signs that mortality trends could become worse in 2013. The most recent data indicate that this elevated death rates has not only continued into 2013, but now also appears to include persons between ages 65 and 85.  A July 2013 ONS report states that “Cumulated 2013 deaths to the beginning of July are 5.6 % higher than the average for the same weeks over 2008-2012. Up to age 65, deaths counts in 2013 are similar to those in 2012; and below those for the previous two years. Over 65, deaths in 2013 have been substantially higher than those for 2012 over the year so far. For those over 85, overall deaths in 2012 were very substantially higher than over the previous two years; and deaths in 2013 look on track to be similarly high.”

Unfortunately, detailed cause of death data for 2013 will not be publicly available until the end of the year. It reminds us of the lack of priority that politicians place on public health data, compared with rapidly available stock market and economic data. At least for now, these worrisome trends call for further monitor and close investigation.

Read Full Post »